This tutorial describes the steps for pre-processing data. In the StarTrail real data analysis, we smoothed the data using a simple radius-based averaging method and then normalized the gene expression. We note that this smoothing step is optional. Here, we demonstrate this process on the human DLPFC 151676 slide.
Load the Data
First, we load the spatial coordinates and gene expression count data:
coords = fread(paste0('./151676/spatial/tissue_positions_list.txt')) %>% as.data.frame(check.names=F) %>%
                filter(V2==1) %>% select(V1,V6,V5) %>% rename(id=V1,x=V6,y=V5)
count_sub = fread(paste0('151676.st.cnt.tsv')) %>% as.data.frame(check.names=F)
rownames(count_sub) = count_sub[,1];count_sub=count_sub[,-1]
count_sub = t(count_sub)
count_sub = cbind(data.table(id = rownames(count_sub)),count_sub)

gene_exp = coords %>% left_join(count_sub)
gene_exp = na.omit(gene_exp)
coords = gene_exp[,c('x','y')]
Spatial Smoothing
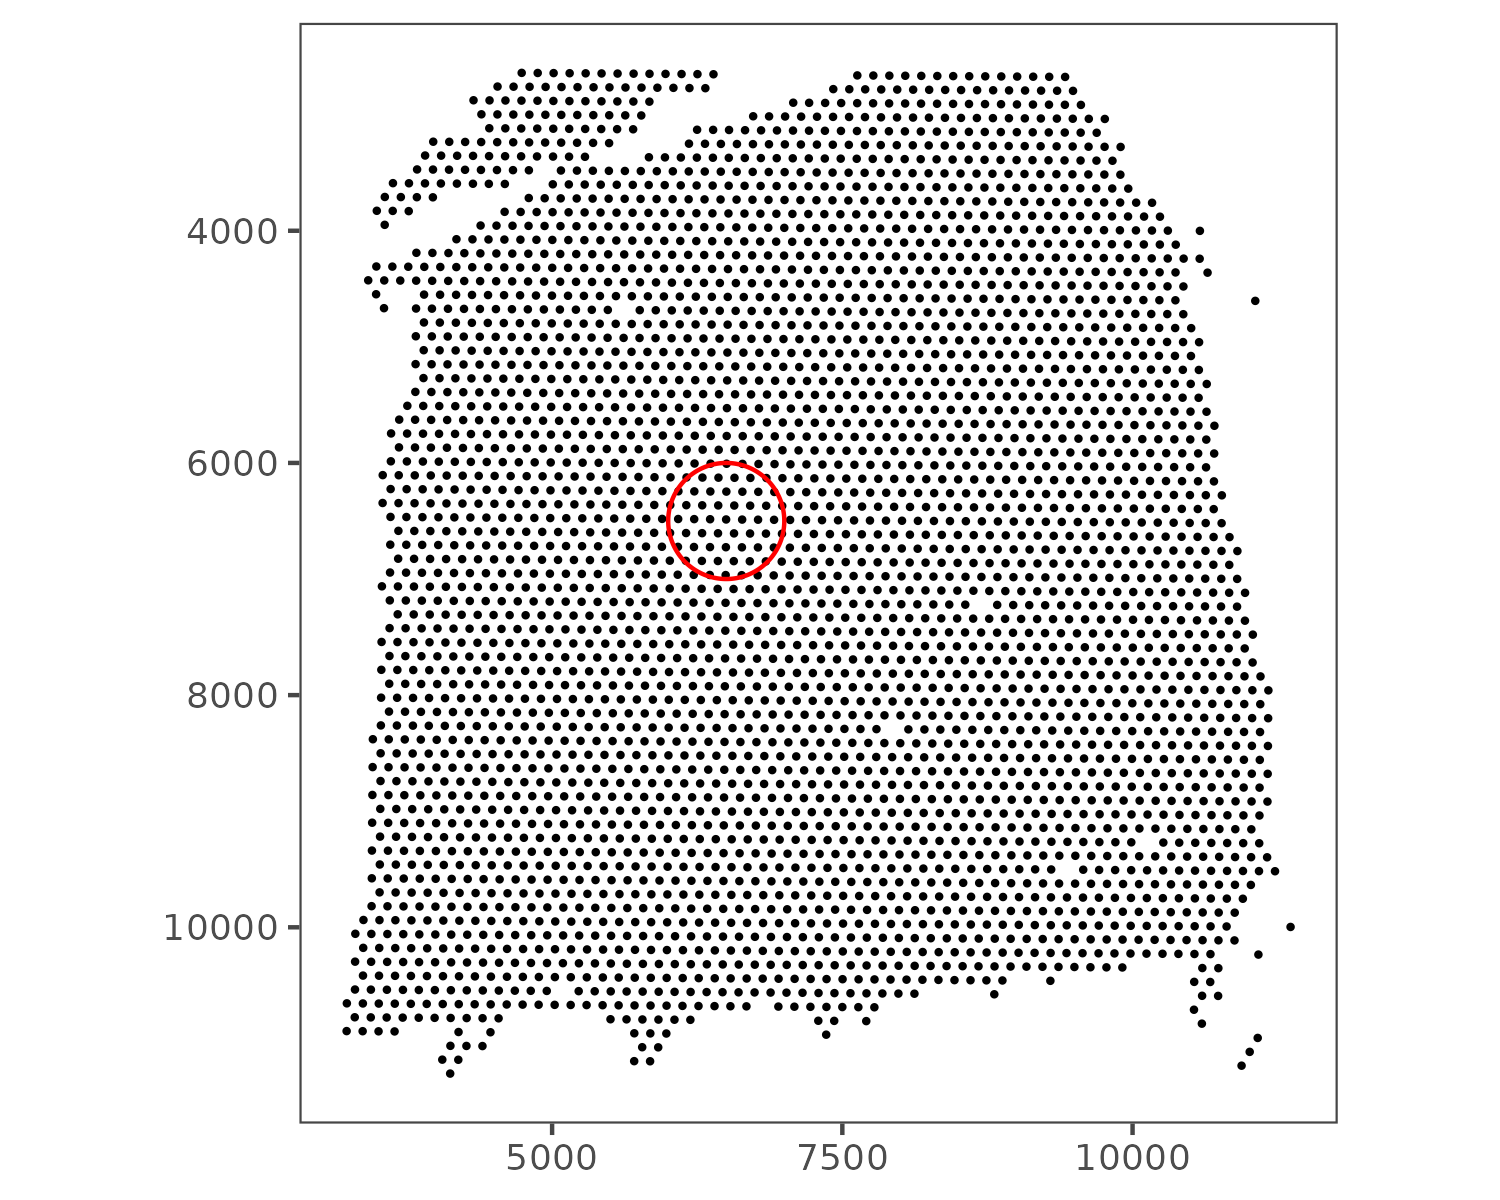
Next, we calculate the distance between spots and apply spatial smoothing. The gene expression of each processed spot is computed as the average of all spots within a circular neighborhood with radius r. In this example, we use r = 500. The figure below illustrates the size of this radius:
We define a distance function and create a weight matrix based on the spatial proximity of spots:
cdist_r <- function(x1, x2) {
  as.matrix(dist(rbind(x1, x2)))[1:nrow(x1), (nrow(x1)+1):(nrow(x1)+nrow(x2))]
}

coord_dist = cdist_r(coords,coords)
coord_dist_temp  = coord_dist
diag(coord_dist_temp)=10000
min_sep = min(coord_dist_temp)

weight = matrix(0,nrow=nrow(coords),ncol=nrow(coords))

r = 500
weight[coord_dist<r] =1
weight = weight/rowSums(weight)


smooth_gene = weight %*% (gene_exp[,-c(1:3)] %>% as.matrix())
smooth_gene = smooth_gene %>% as.data.frame(check.names=F)
rownames(smooth_gene) = gene_exp$id
count_sub = t(smooth_gene)
Gene Expression Normalization
Finally, we normalize the gene expression data using Seurat’s SCTransform method:
st_count = CreateSeuratObject(counts = count_sub)
st_count = SCTransform(st_count, return.only.var.genes = FALSE)
st_data =  st_count@assays$SCT@scale.data
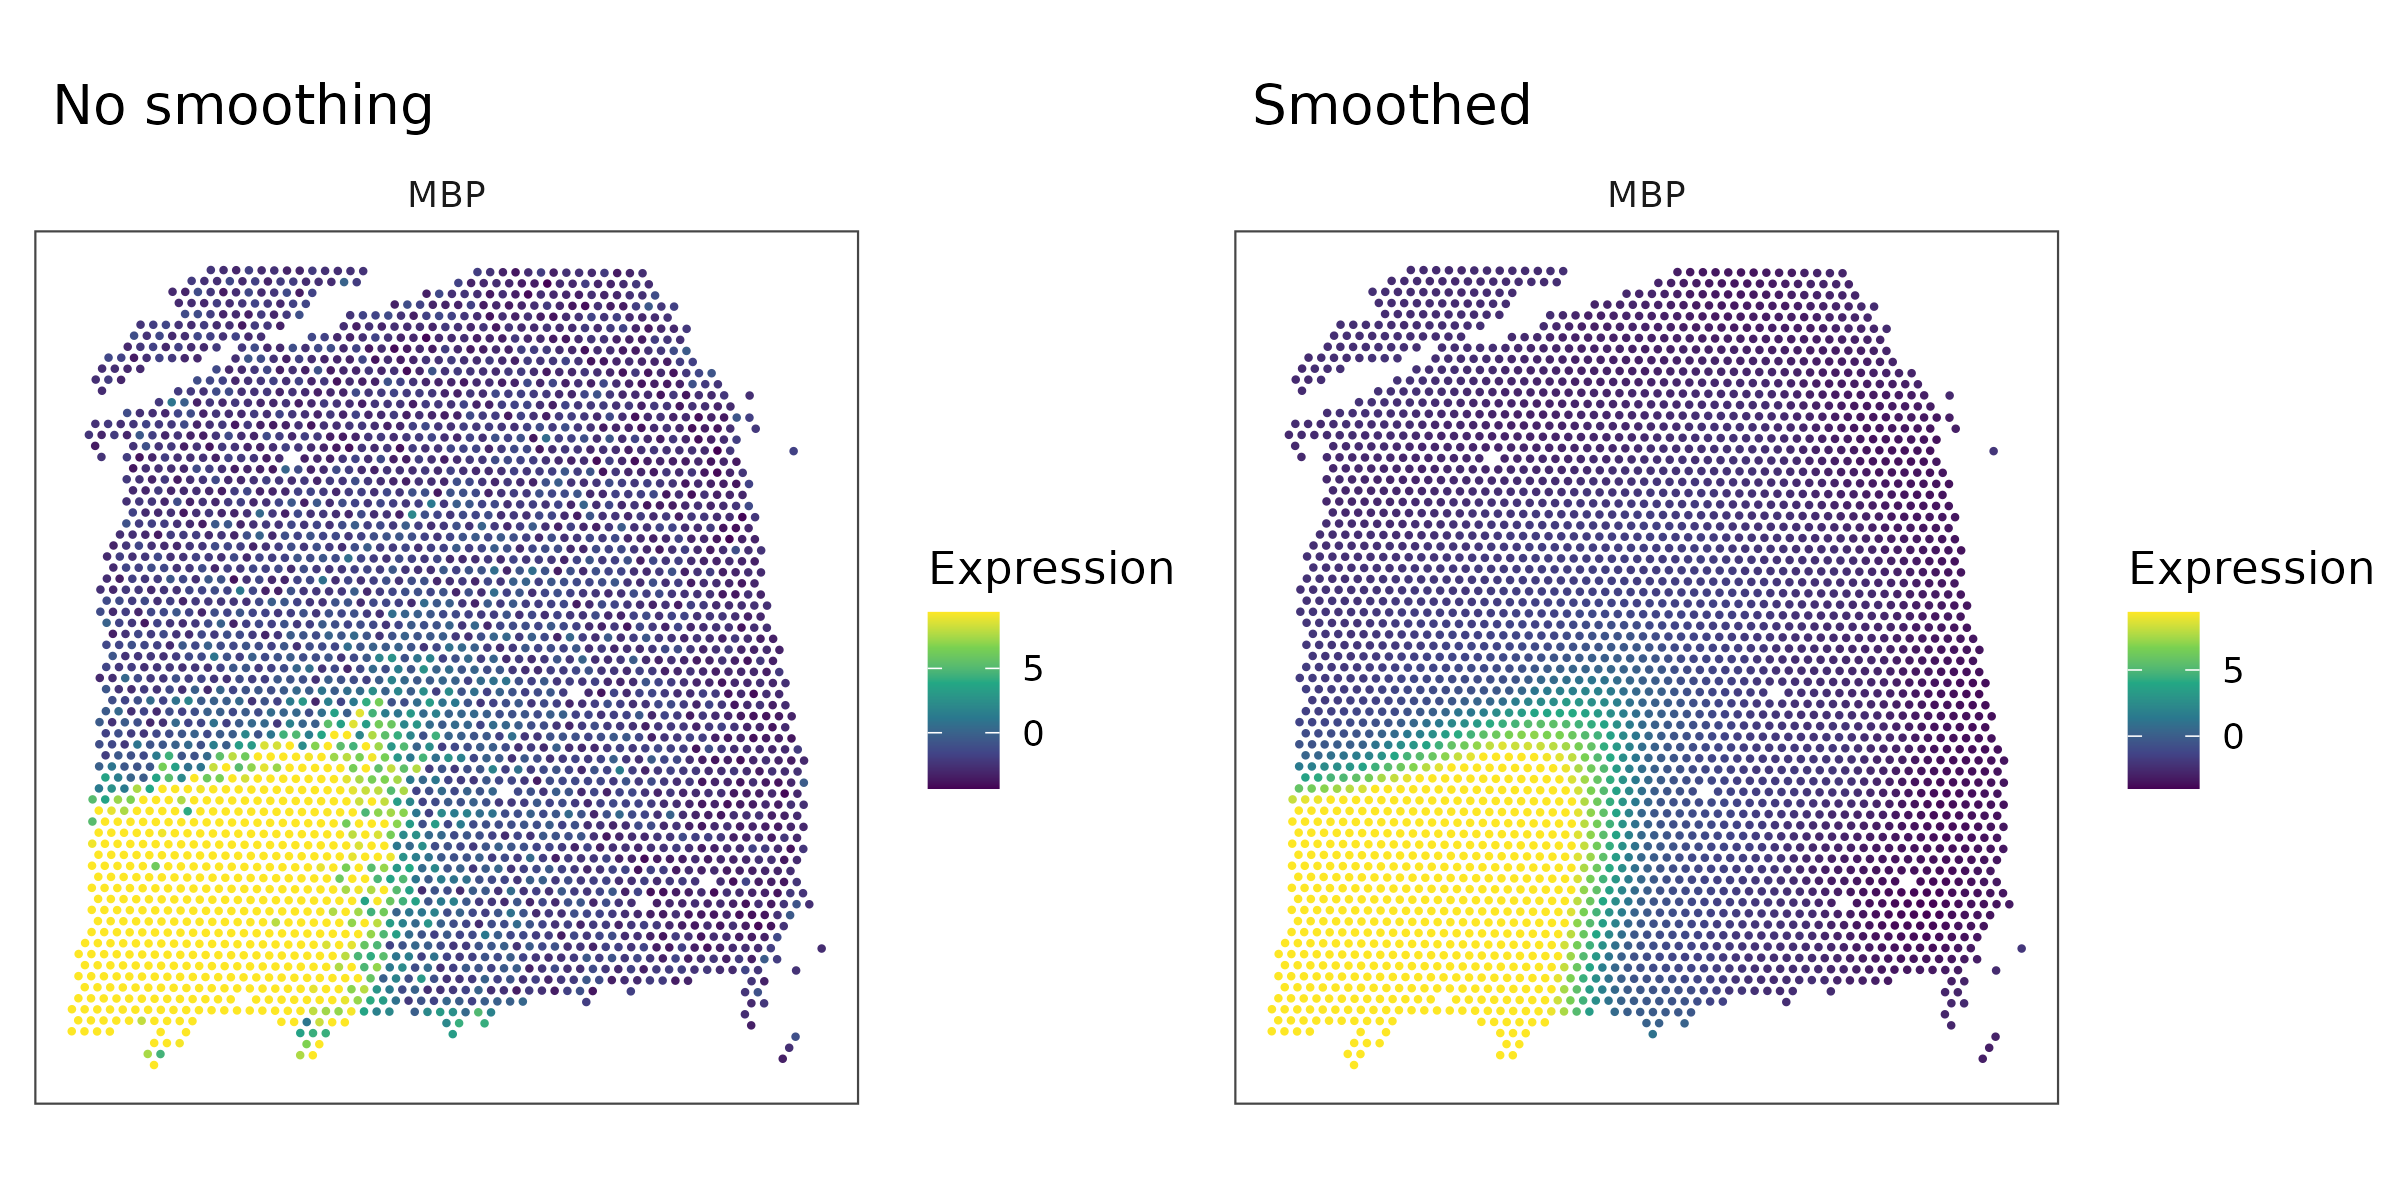
The figure below shows a comparison of the MBP gene expression before and after preprocessing: